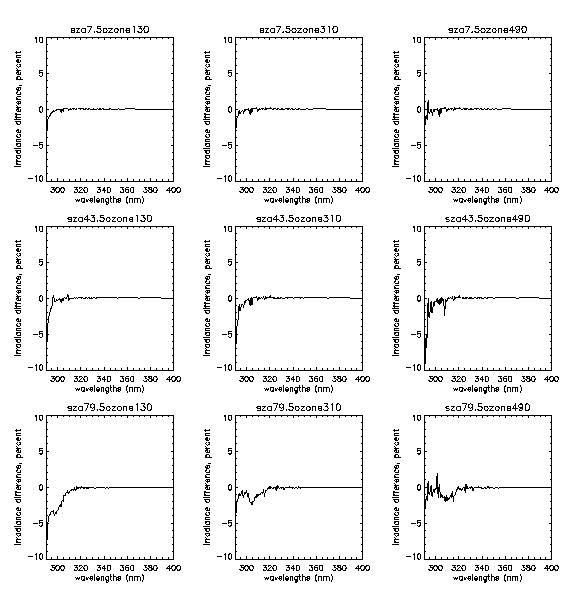
The figures above show the percent difference of the surface irradiance spectra for a clear sky scenario generated by the FastRT model and the libRadtran model with respect to the latter. The plots illustrate the worst case scenarios. The titles indicate solar zenith angles (sza) in degrees and total ozone columns (ozone) in Dobson units.
| Erythema doserates at clear sky obtained by FastRT and libRadtran models and difference wrt. libRadtran. | ||||
| Solar Zenith Angle (deg) | Total Ozone Column (DU) | FastRT | libRadtran (exact) | Percent error |
| 7.5 | 130.0 | 7.683e+02 | 7.860e+02 | 2.253 |
| 7.5 | 310.0 | 2.793e+02 | 2.836e+02 | 1.502 |
| 7.5 | 490.0 | 1.624e+02 | 1.635e+02 | 0.667 |
| 43.5 | 130.0 | 3.492e+02 | 3.573e+02 | 2.258 |
| 43.5 | 310.0 | 1.252e+02 | 1.264e+02 | 0.957 |
| 43.5 | 490.0 | 7.473e+01 | 7.505e+01 | 0.420 |
| 79.5 | 130.0 | 1.439e+01 | 1.458e+01 | 1.303 |
| 79.5 | 310.0 | 6.124e+00 | 6.152e+00 | 0.445 |
| 79.5 | 490.0 | 4.433e+00 | 4.457e+00 | 0.550 |
UV action spectra used in this program
UV-A
Unity between 315nm and 400nm. Zero otherwise.
UV-B
Unity between 280nm and 315nm. Zero otherwise.
Erythema (skin burn) action spectrum *)
McKinlay, A.F. and B.L. Diffey, 1987: A reference action spectrum
for ultraviolet induced erythema in human skin. CIE Research Note,
CIE-Journal, Vol. 6, No.1(17-22).
This action spectrum is now accepted as the reference erythemal spectrum by the International Lighting Commission (CIE).
DNA (skin cancer) action spectrum *)
Setlow, R.B., 1974: The wavelengths in sunlight
effective in producing skin cancer: A theoretical analysis.
Proc.Natl.Acad.Sci., U.S.A. 71:3363-3366.
ACGIH action spectrum *)
ACGIH, 1990: Treshold limit values and biological exposure indices for
1990-1991. American Conference of Governmental Industrial Hygienists (ACGIH), Cincinnati, Ohio, USA.
Proposed sensor for effective UV-irradiance for the monitoring of both natural and artificial weathering conditions
POLY (polymer degradation) action spectrum
Proposed sensor for effective UV-irradiance for the monitoring of both natural and artificial weathering conditions
Wachtendorf, V., Geburtig, A., Trubiroha, P., 9th European Weathering Symposium:
Natural and Artificial Ageing of Polymers. Ed Th. Reichert,
CEEES-Publication No. 19/2019, ISBN978-3-9818507-5-8, p. 293 - 306
SCUP *) / SCUP-M ^) / SCUP-H ACTION SPECTRA ^)
de Gruijl, F.R. and J.C. van der Leun, 1994: Estimate of the wavelength
dependency of ultraviolet carcinogenesis in humans and its relevance to the risk
assessment of a stratospheric ozone depletion. Health Phys., vol 67, 319-325.
PRT (DNA to protein crosslinks) action spectrum *)
M.J. Peak and J.G. Peak, "DNA-to-protein crosslinks and backbone breaks caused
by far- and near-ultraviolet, and visible radiations in mammalian cells". In
Mechanisms of DNA Damage and Repair. Implications for Carcinogenesis and Risk
Assessment, (Edited by M.G. Simic, L. Grossman and A.C. Upton), pp 193-202,
Plenum Press, New York, 1986
SSB (DNA breaks) action spectrum *)
M.J. Peak, J.G. Peak and B.A. Carnes, "Introduction of direct and indirect
single-strand breaks in human cell DNA by far- and near-ultraviolet radiations:
Action spectrum and mechanisms." Photocem. Photobiol., 45, pp.381-387, 1987
Cod egg mortality action spectrum !)
Kouwenberg, J.H.M., H. I. Browman, J. A. Runge, Biological weighting of ultraviolet (280-400 nm) induced mortality in marine zooplankton and fish. I. Atlantic cod (Gadus Morhua) eggs, Marine Biology, 134 (2), 269-284, 1999.
Calanus Finmarchicus mortality action spectrum !)
Kouwenberg, J.H.M., H. I. Browman, J.-F. St-Pierre, Biological weighting of ultraviolet (280-400 nm) induced mortality in marine zooplankton and fish. II. Calanus Finmarchicus (Copepoda) eggs, Marine Biology, 134 (2), 285-293, 1999.
Vitamin D action spectrum +)
Holick, M, R. Bouillon, J. Eisman, M. Garabedian, J. Kleinschmidt, T. Suda, I. Terenetskaya, A. Webb. CIE Technical Committee 6-54 Technical Report 174 (2006) Action spectrum for production of previtamin D3 in human skin. Commission Internationale de l'Eclairage (CIE) Central Bureau. Vienna, Austria, email: ciecb@ping.at
Vitamin D action spectrum (old version)
MacLaughlin JA, Anderson RR, Holick MF. Spectral character of
sunlight modulates the photosynthesis of previtamin D3 and its photoisomers
in human skin. Science. 1982; 1001-1003.
The action
spectrum has been normalized to unity at 295 nm.
Beyond 315 nm, the action
spectrum was extrapolated by an exponential decay function.
POL (polychromatic actions spectrum for higher plants) *)
M.M. Caldwell, L.B. Camp, C.W. Warner and S.D. Flint, "Action spectra and
their key role in assessing biological consequences of solar UV-B
radiation", In Stratospheric Ozone Reduction, Solar Ultraviolet Radiation
and Plant Life, Worrest Caldwell (eds.), pp.87-111, Springer, Heidelberg,
1986
PTP (phytoplankton photoinhibition) action spectrum *)
Mitchell, B.G., "Action Spectra for ultraviolet photoinhibition of Antarctic
phytoplankton and a model of spectral diffuse attenuation coefficients", In
Response of Marine Phytoplankton to Natural Variations in UV-B Flux, (Edited by
G. Mitchell, I. Sobolev and O. Holm-Hansen), Proc. of Workshop, Scripps
Institution of Oceanography, La Jolla, CA, April 5, 1990
PTP2 (Prorocentrum) and PTP3 (Phaeodactylum) action spectrum *)
Cullen, J. J., P. J. Neale and M. P. Lesser, 1992: Biological weighting
function for the inhibition of phytoplankton photosynthesis by ultraviolet
radiation. Science. 258, 646-650.
TYP (typhimurium killing) action spectrum *)
McKay, D., A. Eisenstark, R.B. Webb and S. Brown, "Action spectra for lethality
in recombinationless strains of Salmonella typhimurium and Escherichia coli",
Photochem. Photobiol., 24, pp.337-343, 1976
Plant Damage Action Spectrum *)
ATTENTION! Plant response is normalised at 300 nm.
Caldwell, M.M., L.B. Camp, C.W. Warner, S.D. Flint, 1986: Action spectra and
their key role in assessing biological consequences of solar UV-B radiation
change. In: Worrest, R.C. and M.M. Caldwell (Eds.): Stratospheric ozone
reduction, solar ultraviolet radiation and plant life. Springer-Verlag,
Berlin. p.87-111.
Mammalian Non-melanoma Skin Cancer Action Spectrum ^)
de Gruijl, F.R. and J.C. van der Leun. 1994. Estimate of the wavelength
dependency of ultraviolet cacinogenesis in humans and its relevance to the risk
assessment of stratospheric ozone depletion. Health Physics, 67: 319-325.
Erythemal (skin burn) Action Spectrum 2 ^)
McKinlay, A.F. and B.L. Diffey. 1987. A reference action spectrum for
ultra-violet induced erythema in human skin. In Human Exposure to Ultraviolet
Radiation: Risks and Regulations. W.F. Passchier and B.F.M. Bosnjakovich, eds.
International Congress Series. pp. 83-87.
DNA Damage Action Spectrum ^)
Setlow, R.B. 1974. The wavelengths in sunlight effective in producing cancer: a
theoretical analysis. Proceedings of the National Academy of Sciences U.S.A.,
71: 3363-3366.
Melanoma Induction in Platyfish-swordtail Hybrids Action Spectrum ^)
Setlow, R.B., E. Grist, K. Thompson, and A.D. Woodhead. 1993. Wavelengths
effective in induction of malignant melanoma. Proceedings of the National
Academy of Sciences U.S.A., 90: 6666-6670.
UV-Index (WMO)
World Meteorological Organization (WMO), Report of the WMO Meeting of Experts on
UV-B Measurements, Data Quality and Standardization of UV Indices, World
Meteorological Organization Global Atmosphere Watch, Report No. 95, 1994
United States Environmental Protection Agency, Office of Air and Radiation, Stratospheric Protection Division, 6205-J, EPA 430-H-94-003, February 1995, URL: http://www.cpc.ncep.noaa.gov/products/stratosphere/uv_index/uv_compute.shtml
*) Courtesy of Dr. Tapani Koskela, Finnish Meteorological Institute, Helsinki, Finland
Main source:
Morys M. and D.Berger, 1993: The accurate measurements of biologically effective
ultraviolet radiation. SPIE Proc. Vol.2049, Atmospheric Radiation, pp. 152-161.
^) Courtesy of Dr. Darryl H Charache, Consortium for International Earth Science Information Network (CIESIN), MI 48710, USA
+) Courtesy of Ann Webb, University of Manchester, Exponential decay extrapolation beyond 315 nm
!) Courtesy of Dr. Ralf Meerkoetter, DLR-Institut fuer Physik der Atmosphaere, Oberpfaffenhofen, D-82234 Wessling, Germany
References
Mayer, B., G. Seckmeyer and A. Kylling, Systematic longterm comparison of spectral UV measurements and UVSPEC modeling results, Journal of Geophysical Research, 102, 8755-8767, 1997.Kylling A, Stamnes K and Tsay S C: "A reliable and efficient two-stream algorithm algorithm for spherical radiative transfer: Documentation of accuracy in realistic media", J. Atm. Chem., 21, 115-150, 1995
Anderson G P, Clough S A, Kneizys F X, Chetwynd J H, Shettle E P, AFGL atmospheric constituent profiles (0-120km), Tech. Rep. AFGL-TR-86-0110, Air Force Geophys. Lab., Hascom Air Force Base, Mass., 1986
Van Hoosier, 1996, ftp susim.nrl.navy.mil, cd pub.uars
Molina and Molina, Journal of Geophysical Research, vol. 91, pp 14501-14508, 1986
Shettle E P, "Models of aerosols, clouds and precipitation for atmospheric propagation studies, In Atmospheric propagation in the UV, visible, IR and MM-region and related system aspects, AGARD Conf. Proc. pp. 15-1-15-13, 1989
Stamnes K, Tsay S C, Wiscombe W and Jayaweera K, "A numerically stable algorithm for discrete ordinate method radiative transfer in multiple scattering and emitting layered media, Applied Optics, 27, 2502-2509, 1988
Dahlback A and Stamnes K, "A new spherical model for computing the radiation field available for photolysis and heating at twilight", Planet. Space Sci., 39, 671-683, 1991
U. Feister and R. Grewe, Spectral albedo measurements in the UV and visible region over different types of surfaces, Photochemistry and Photobiology, 62, 736-744, 1995.
M. Blumthaler and W. Ambach, Solar UVB-Albedo of various surfaces, Photochemistry and Photobiology, 48, 1, pp. 85-88, 1988